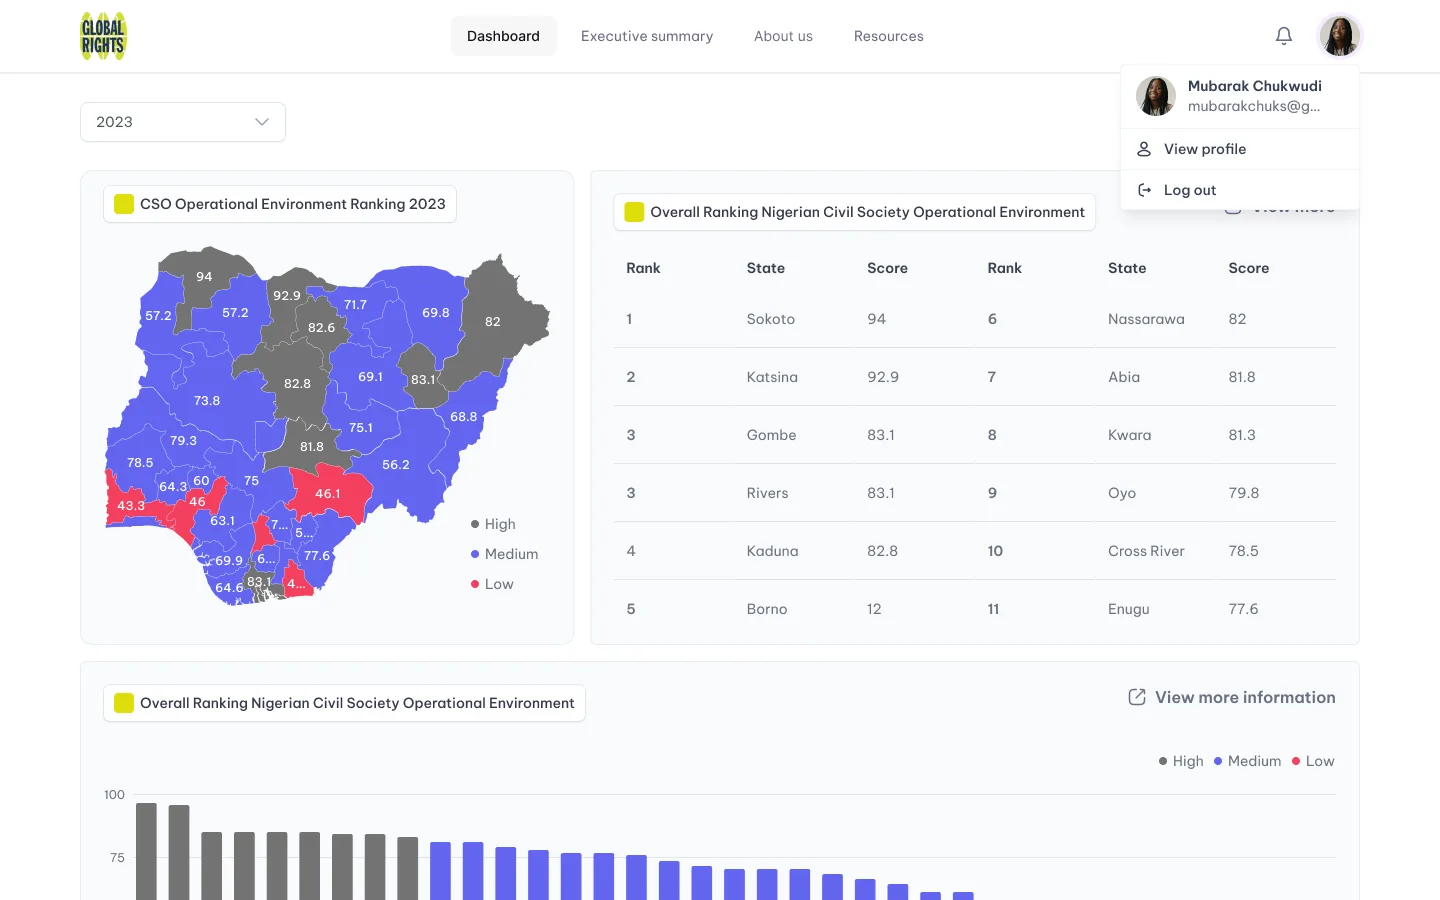
Global Rights Nigeria scores every state on how well its laws support civil society. I turned that report into a live public ranking, with an admin platform so the team can publish new data themselves.
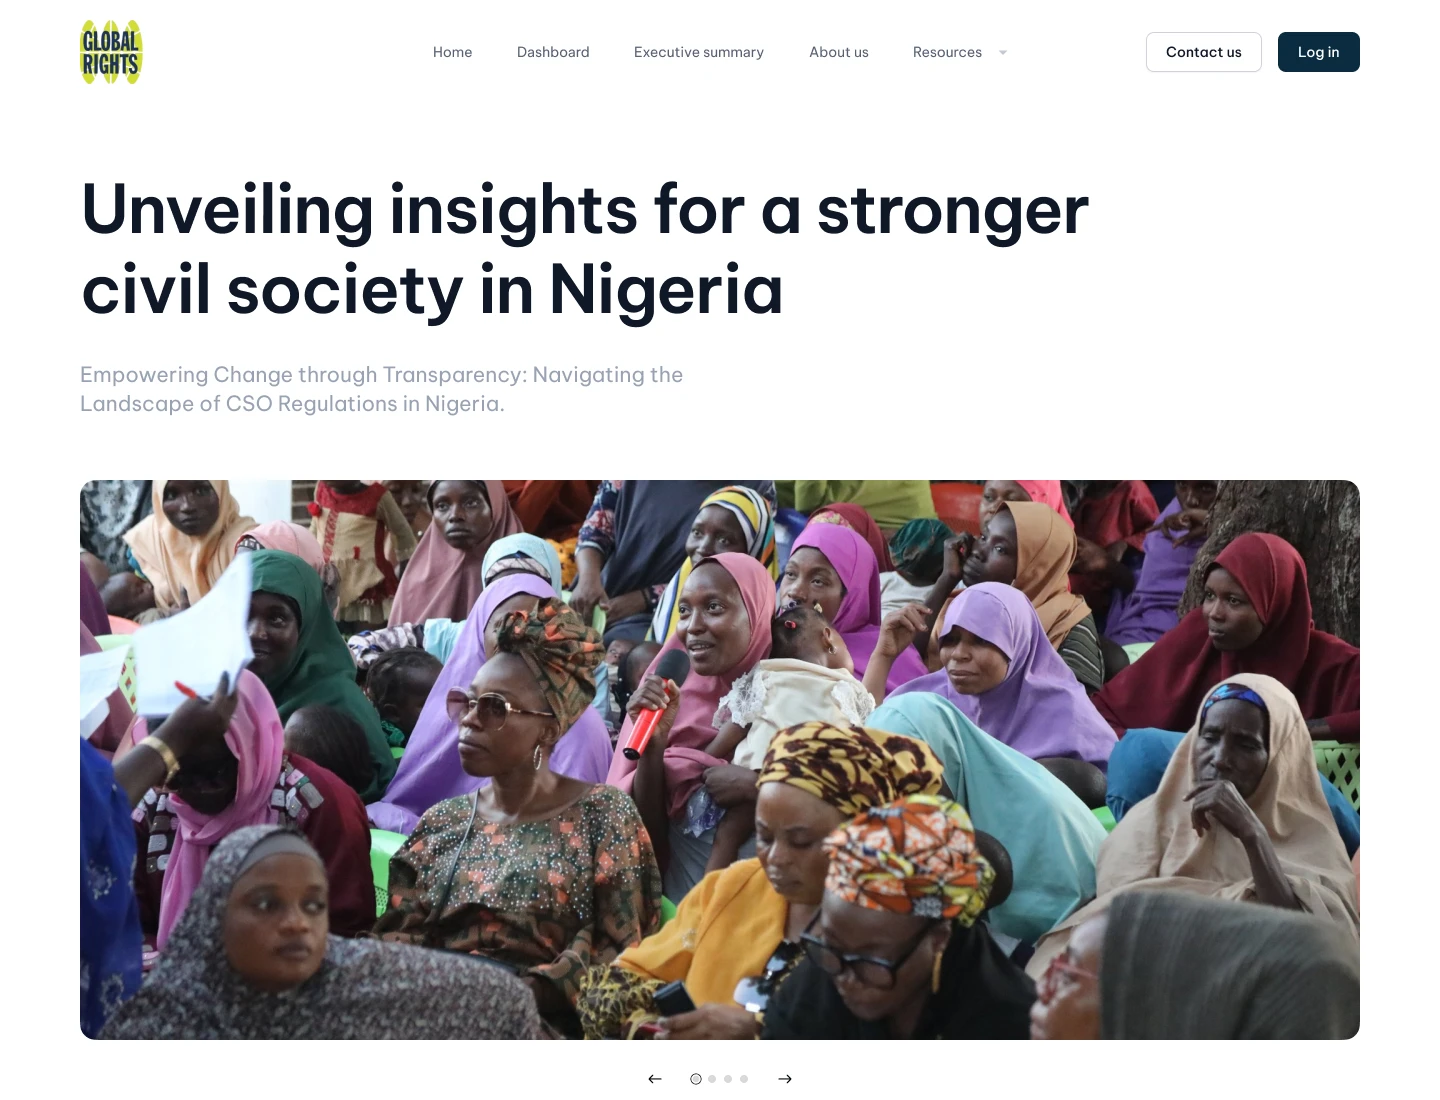
How a report became a tool.
The goal was to let stakeholders, policymakers and the public see in seconds how each of Nigeria's 36 states and the FCT ranks on creating a good environment for civil society, and to let Global Rights keep that data current without a designer or developer.
We shipped a public dashboard, an admin platform and a website.
Compare, drill down, track progress.
Global Rights publishes an assessment that scores each state against regulatory indicators. As a static report, it was hard to compare states, hard to see change over time, and out of date the moment it was printed. Making it interactive lets people compare, drill down and track progress, which is what pushes states to act.
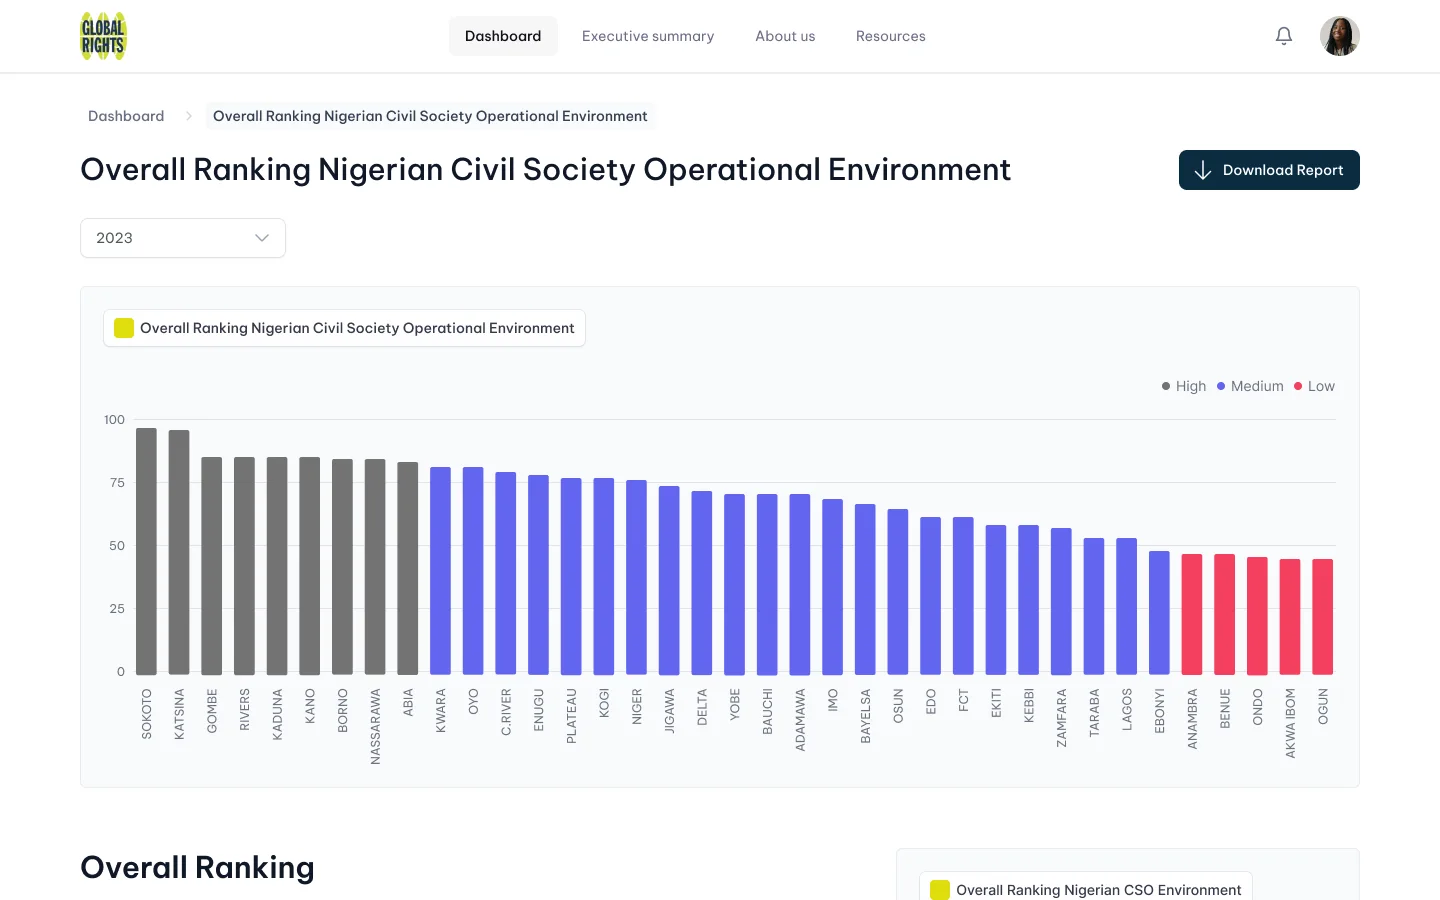
What Global Rights asked for.
- 01
Overall rankings, by geopolitical zone and by state.
- 02
Indicator rankings for every state.
- 03
A description of each indicator, one click away.
- 04
Filters by indicator, state and zone.
- 05
An admin platform for the team to edit the visualisations themselves.
- 01
37 units, many indicators, several years.
The layout had to hold all 36 states plus the FCT without becoming a wall of numbers.
- 02
The data lives with a non-technical team.
The admin flow needed validation and a preview, because a wrong score published publicly hurts credibility.
- 03
Meaning matters as much as the score.
Each indicator's description and measure had to sit next to the data, not in a separate report.
- 04
A new assessment every year.
The brief describes a dashboard updated annually, so every view is tied to a year selector, and the admin flow starts by choosing the report year.
“When I'm making the case for reform in a state, I want to show how it ranks and on which indicators, so I can point to exactly what needs to change.”
“When a new assessment comes in, I want to publish it without breaking anything.”
Overview first, detail on demand.
- 01
Home
The same ranking shown three ways: a map for where states sit, a ranked table for exact positions, and a bar chart for the spread from high to low. Below them, one chart per indicator, for comparison at a glance.
- 02
Indicator page
A chart over time with a year filter, the measure and description from the report, and a geopolitical-zone filter for drilling down.
- 03
Admin
A step-by-step create flow, from title and year to scores per state and a description, with a preview before publishing, which protects the organisation's credibility.
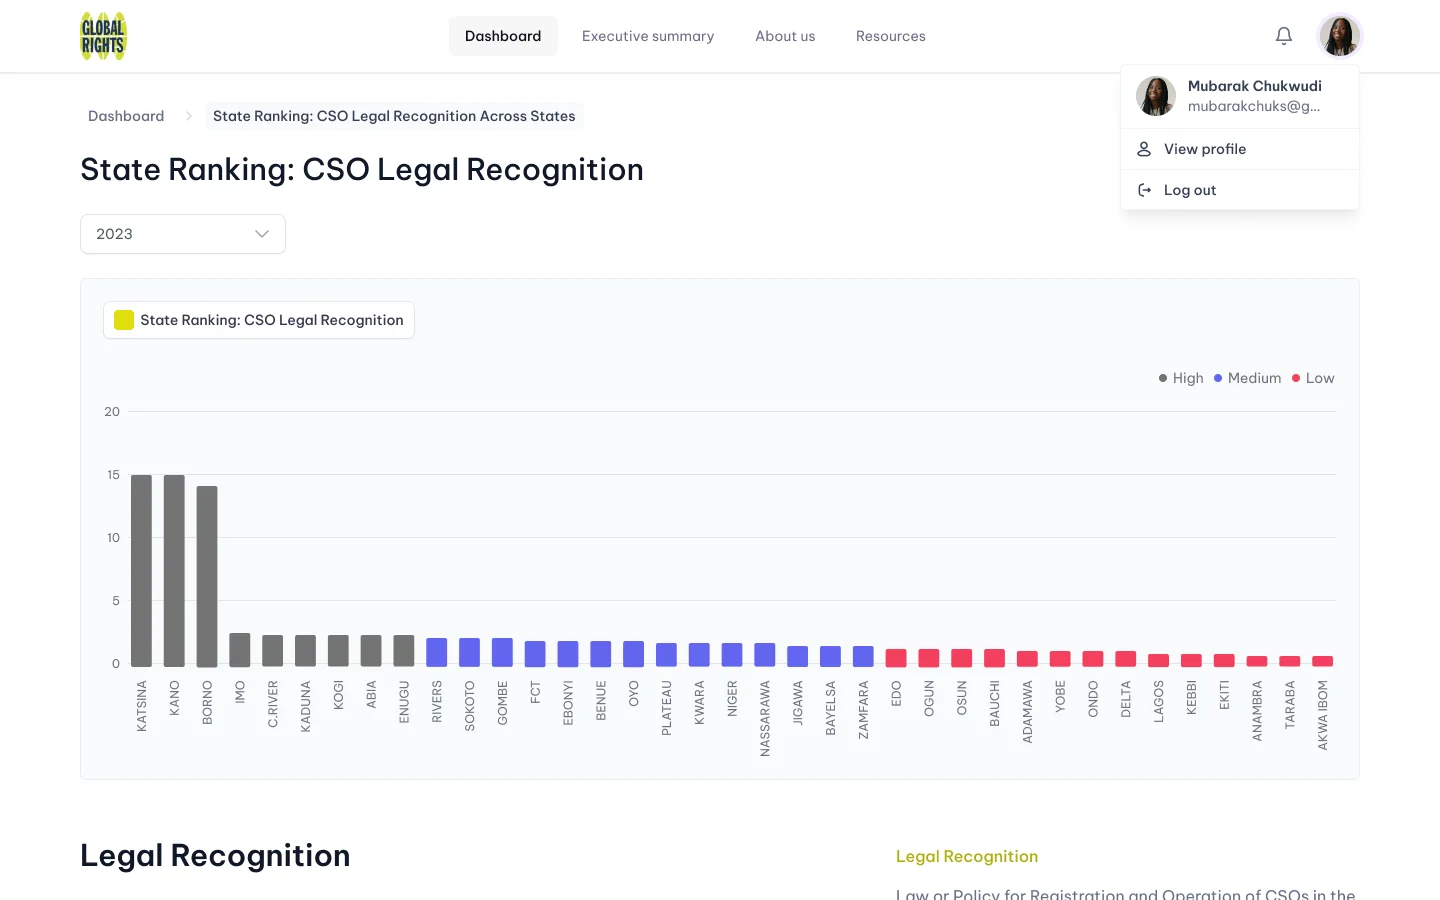
Public
- Ranking dashboard with zone and state filters
- Indicator pages with time series
- Indicator description modals
Behind it
- Admin: create, edit, preview, publish
- A website introducing the project
Engagement beyond what Global Rights expected.
Civil society organisations across Nigeria took up the dashboard quickly, and their feedback was overwhelmingly positive. Global Rights kept its numbers private, but told us engagement and responses exceeded its expectations.
Comparing states side by side gave advocates something a static report never could: a public, current answer to “how does my state compare, and on what?”